A confidential performance-reporting workstream connecting direct and allocated costs to profitability by shop, region, division and channel.
My roleFinancial analysis & dashboard design
ToolsPower BI · Profitability reporting · Allocation · NDA
TypeConfidential client engagement
NDAConfidential client engagement
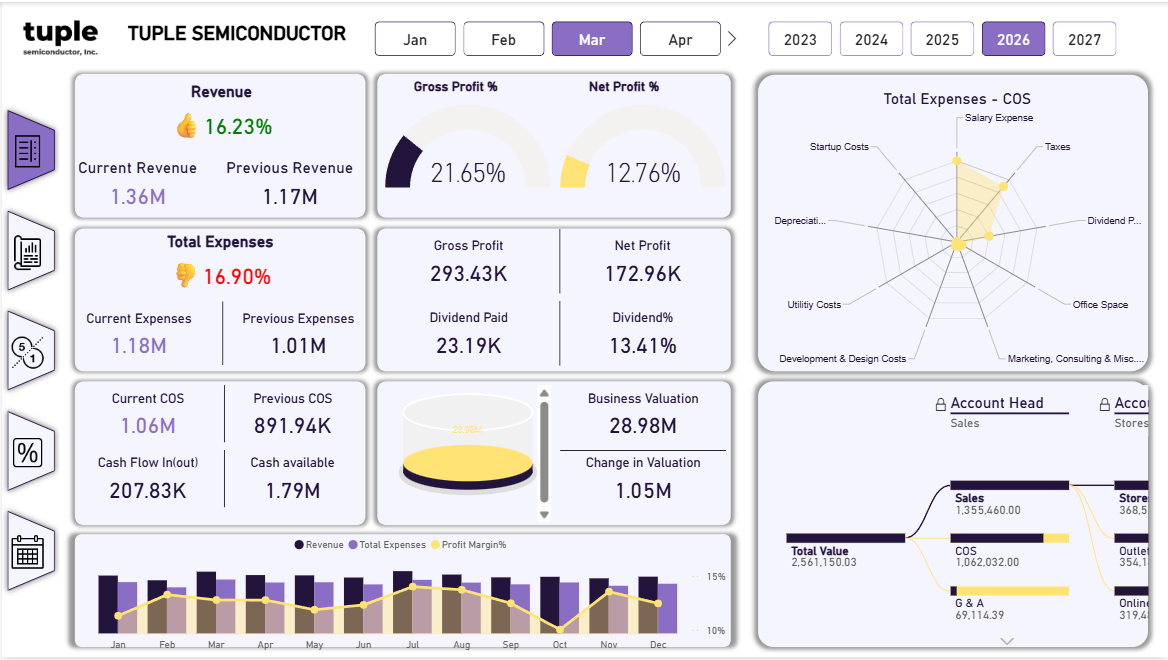
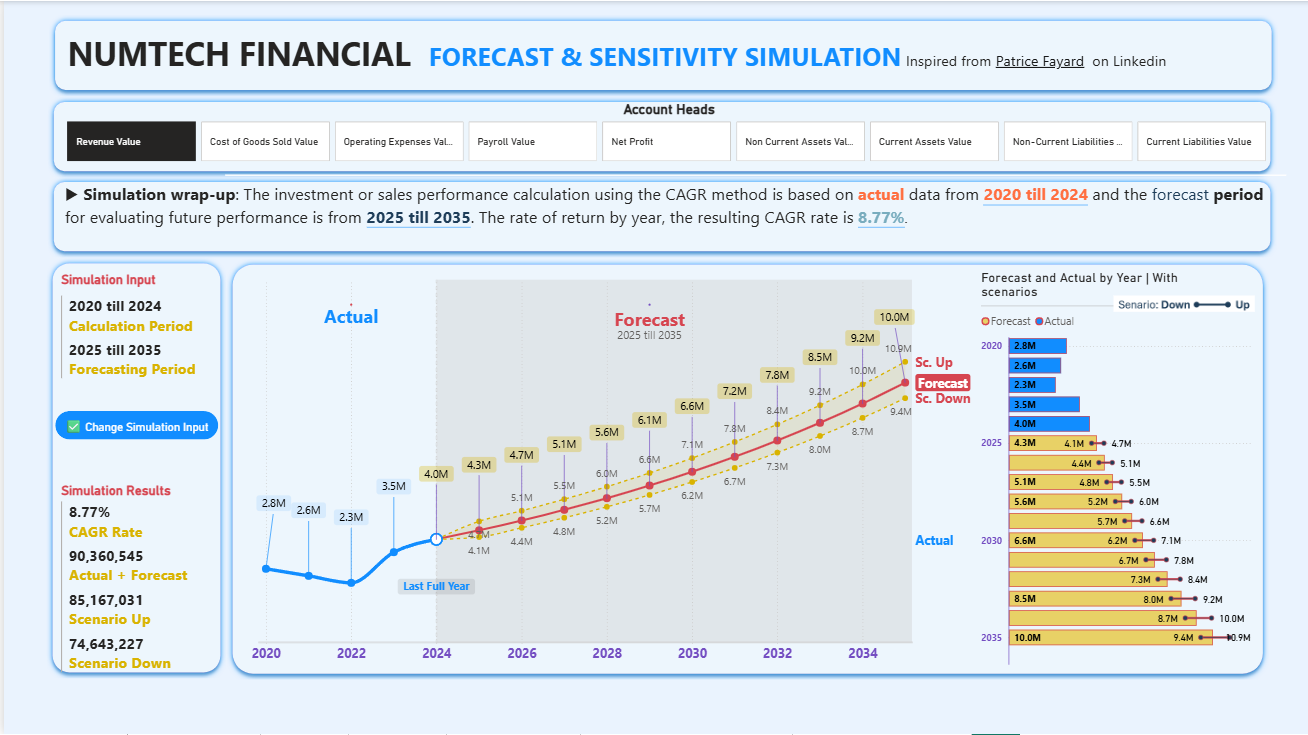
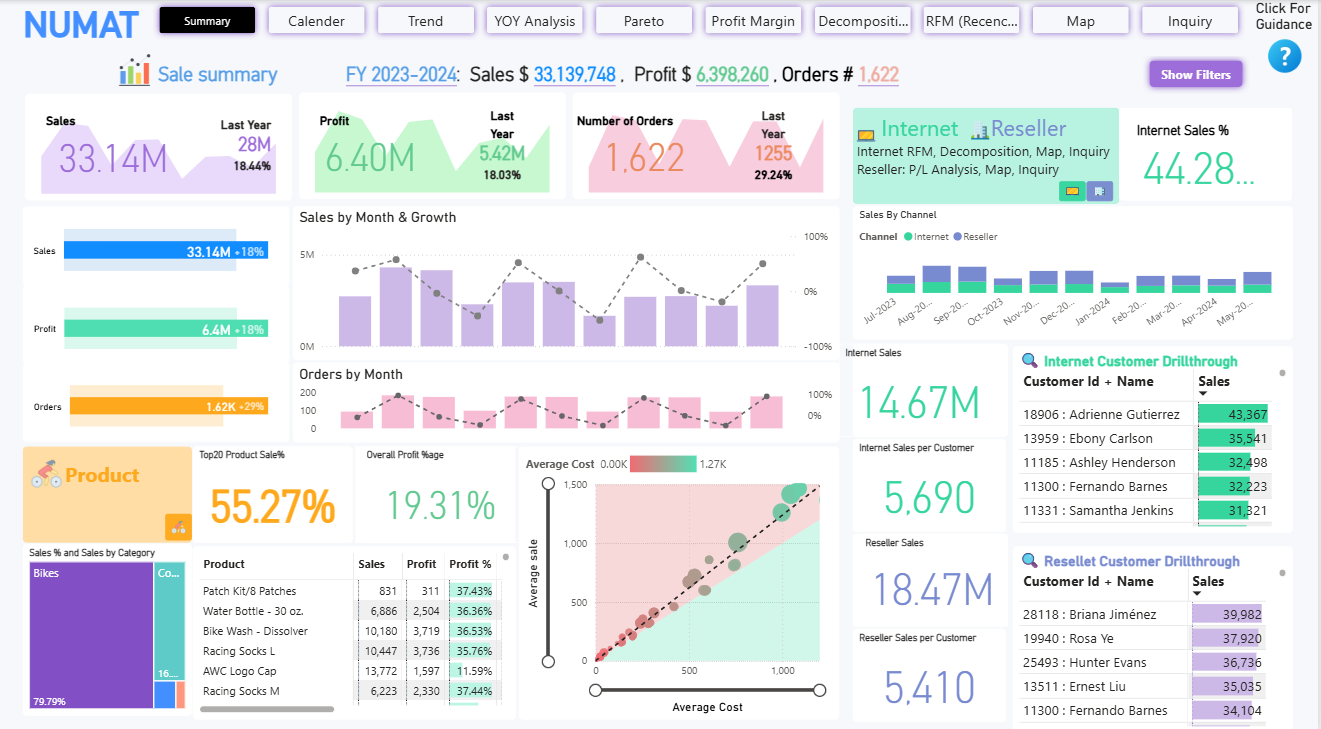
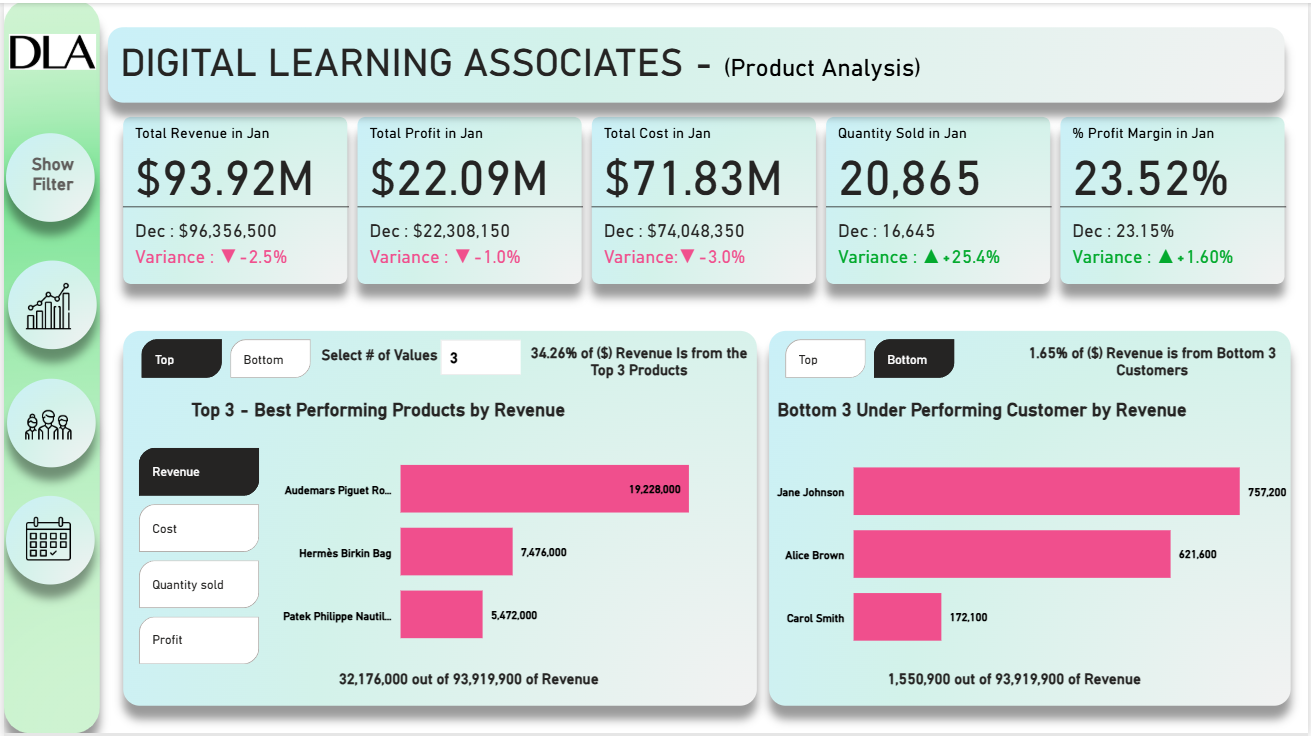
Representative visuals are being prepared using anonymized data.
The brief
From business question to decision-ready view.
01
Business question
Management needed a consistent view of profitability after direct and allocated expenses, with the ability to move from regional totals to shop, division and channel detail. Client identifiers, figures and report design remain confidential.
02
The approach
Mapped direct and allocated expense logic.
Structured profitability views by region, division, channel and shop.
Connected expense reporting to allocated net profit and margin measures.
Designed drill-through views for investigation.
03
Key insights
Direct-versus-allocated cost visibility
Shop, region, division and channel profitability
Allocated net-profit reporting
Drill-through management detail
04
Decisions this supports
Where direct or allocated cost is changing profitability
Which shop, region, division or channel needs investigation
Which allocation or expense rule should be reviewed
Dashboard views
See what the analysis is built to show.
Representative visuals are shown only when labels, figures and identifiers can be shared safely.
NDA
Dashboard visuals are being anonymized.
Representative screenshots and captions will be added here once confidential labels, figures and identifiers have been replaced.
Representative scope
What the engagement was built to improve.
Representative scope showing how profitability moves from consolidated reporting to operating detail.
Direct and allocated expense logic
Profitability by region, division, channel and shop
Allocation and drill-through review workflow
Anonymized structure
Representative profitability reporting flow
A generic path showing how direct and allocated costs become actionable profitability detail.
01
Allocation inputs
Direct expenses, allocation rules and organisational mappings
02
Profitability layer
Region, division, channel and shop measures
03
Decision output
Margin, allocated net profit, exception and follow-up signals
Representative framework only. It contains no client names, figures, source systems or confidential business information.
Start a conversation
Have a similar reporting or modelling question?
Share the decision you need to support and the data or report you already have.