Business question
Management needed a consolidated view of growth and profitability across internet and reseller channels, products, customers and locations.
Commercial finance
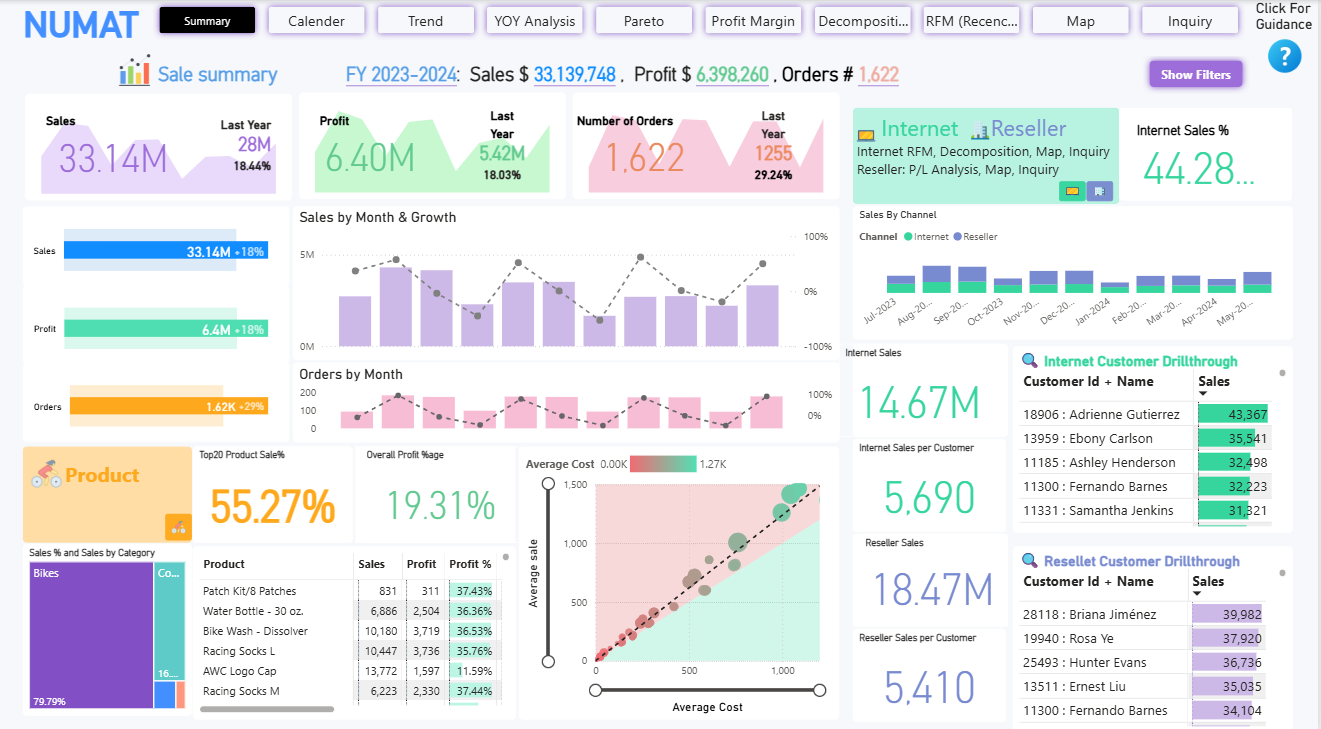
An executive sales and profitability dashboard covering channel performance, monthly trends, product contribution, customer drill-through and geographic analysis.
The brief
Management needed a consolidated view of growth and profitability across internet and reseller channels, products, customers and locations.
Figures below describe the displayed portfolio dataset, not a client outcome.
The transformation
The NUMAT SALES system turns fragmented reporting into a shared operating view for sales, finance and leadership teams.
Interactive report
Use the report controls to navigate pages, filter the data and inspect individual views.
The interactive report is best viewed in a larger window.
Open interactive report (opens in a new tab)Public portfolio report. The demonstration data is intentionally non-confidential.
Open report in a new tab (opens in a new tab)Sales dashboard walkthrough
The NUMAT SALES report brings summary performance, time patterns, geographic breakdowns, customer segmentation and product concentration into one navigable Power BI experience.
Portfolio sales, profit, orders, channel mix, product contribution and customer drill-through in one management view.
Start a conversation
Share the decision you need to support and the data or report you already have.
Work
Browse the complete portfolio of dashboards, models and reporting work. Choose another case study without leaving this page.
 01
01 0203
0203 04
04 05
05 06
06 07
07 08
08 09
09 10
10Use the arrows or swipe to browse the full case-study library.