Business question
Forecast discussions become difficult when the historical base, growth rate and scenario assumptions are spread across separate worksheets or presented without a clear visual relationship.
Forecasting & scenario analysis
A finance-led forecast dashboard connecting historical performance, CAGR-based projections and upside/downside scenarios in one decision-ready view.
The brief
Forecast discussions become difficult when the historical base, growth rate and scenario assumptions are spread across separate worksheets or presented without a clear visual relationship.
Figures below describe the displayed portfolio dataset, not a client outcome.
Interactive report
Use the report controls to navigate pages, filter the data and inspect individual views.
The interactive report is best viewed in a larger window.
Open interactive report (opens in a new tab)Public portfolio report. The demonstration data is intentionally non-confidential.
Open report in a new tab (opens in a new tab)Simulation walkthrough
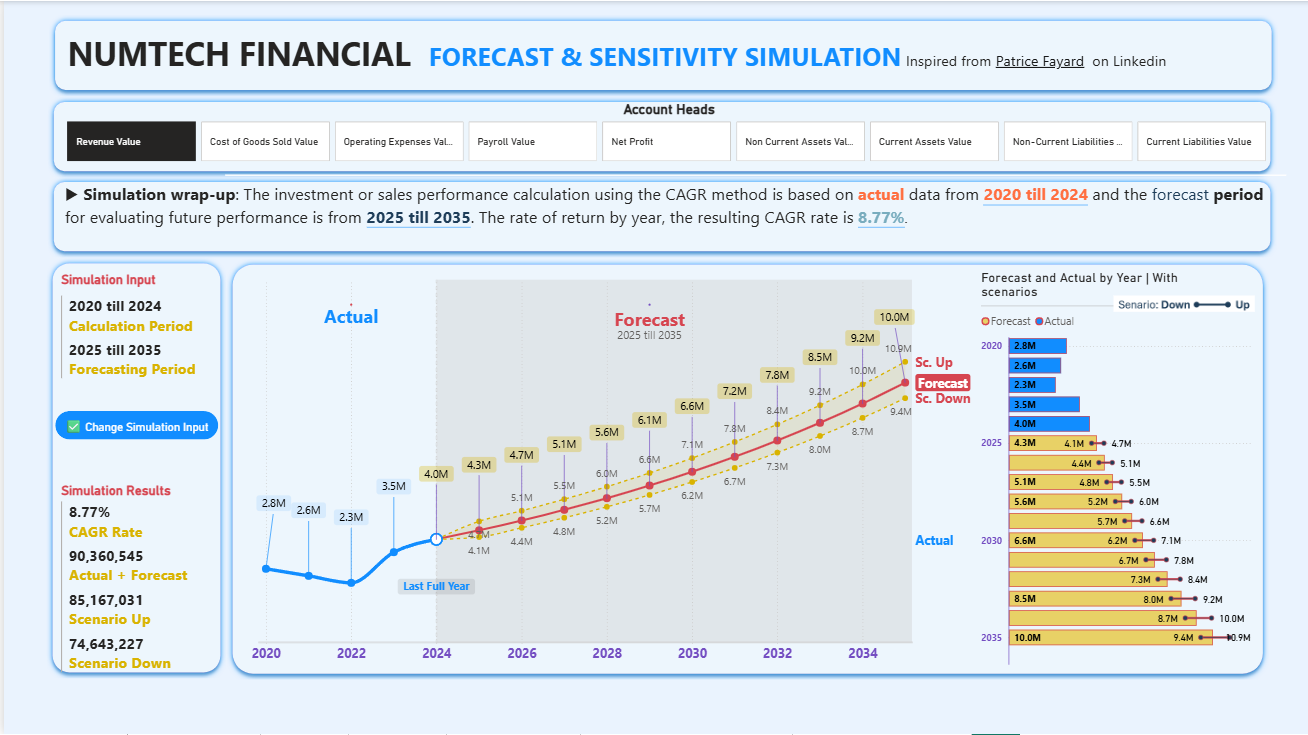
The Numtech view connects historical results to a forecast period, then makes the assumptions and scenario ranges visible enough to support a practical planning conversation.
Actual performance through 2024 compared with the 2025–2035 forecast and upside/downside scenarios.
Start a conversation
Share the decision you need to support and the data or report you already have.
Work
Browse the complete portfolio of dashboards, models and reporting work. Choose another case study without leaving this page.
 0102
0102 03
03 04
04 05
05 06
06 07
07 08
08 09
09 10
10Use the arrows or swipe to browse the full case-study library.