Business question
A mixed residential and commercial development needed a single model to assess feasibility, compare sell-versus-hold strategies, understand when cash would be needed and test alternative funding structures.
Financial planning & analysis
An integrated FP&A model connecting development assumptions, quarterly cash flow, financing, investment appraisal and executive decision support.
The brief
A mixed residential and commercial development needed a single model to assess feasibility, compare sell-versus-hold strategies, understand when cash would be needed and test alternative funding structures.
Figures below describe the displayed portfolio dataset, not a client outcome.
Analysis walkthrough
Each layer is connected so decision-makers can trace an executive result back to the development, commercial and financing assumptions that produced it.
Define area, project-life, construction, pricing, operating and financing assumptions in a controlled input layer.
Connect development costs and revenue strategies to quarterly cash flow, financial statements and funding requirements.
Calculate FCFF, NPV, IRR and discounted payback, then compare DCF and market-comparable valuation approaches.
Review the effect of commercial mix, price, CAPEX, HR cost and financing changes on cash needs and returns.
Summarize feasibility, liquidity, funding, return and break-even signals in an executive management dashboard.
Model walkthrough
The views below show the model mechanics as well as the executive output: inputs, cost phasing, cash and funding, valuation, payback and sensitivity.
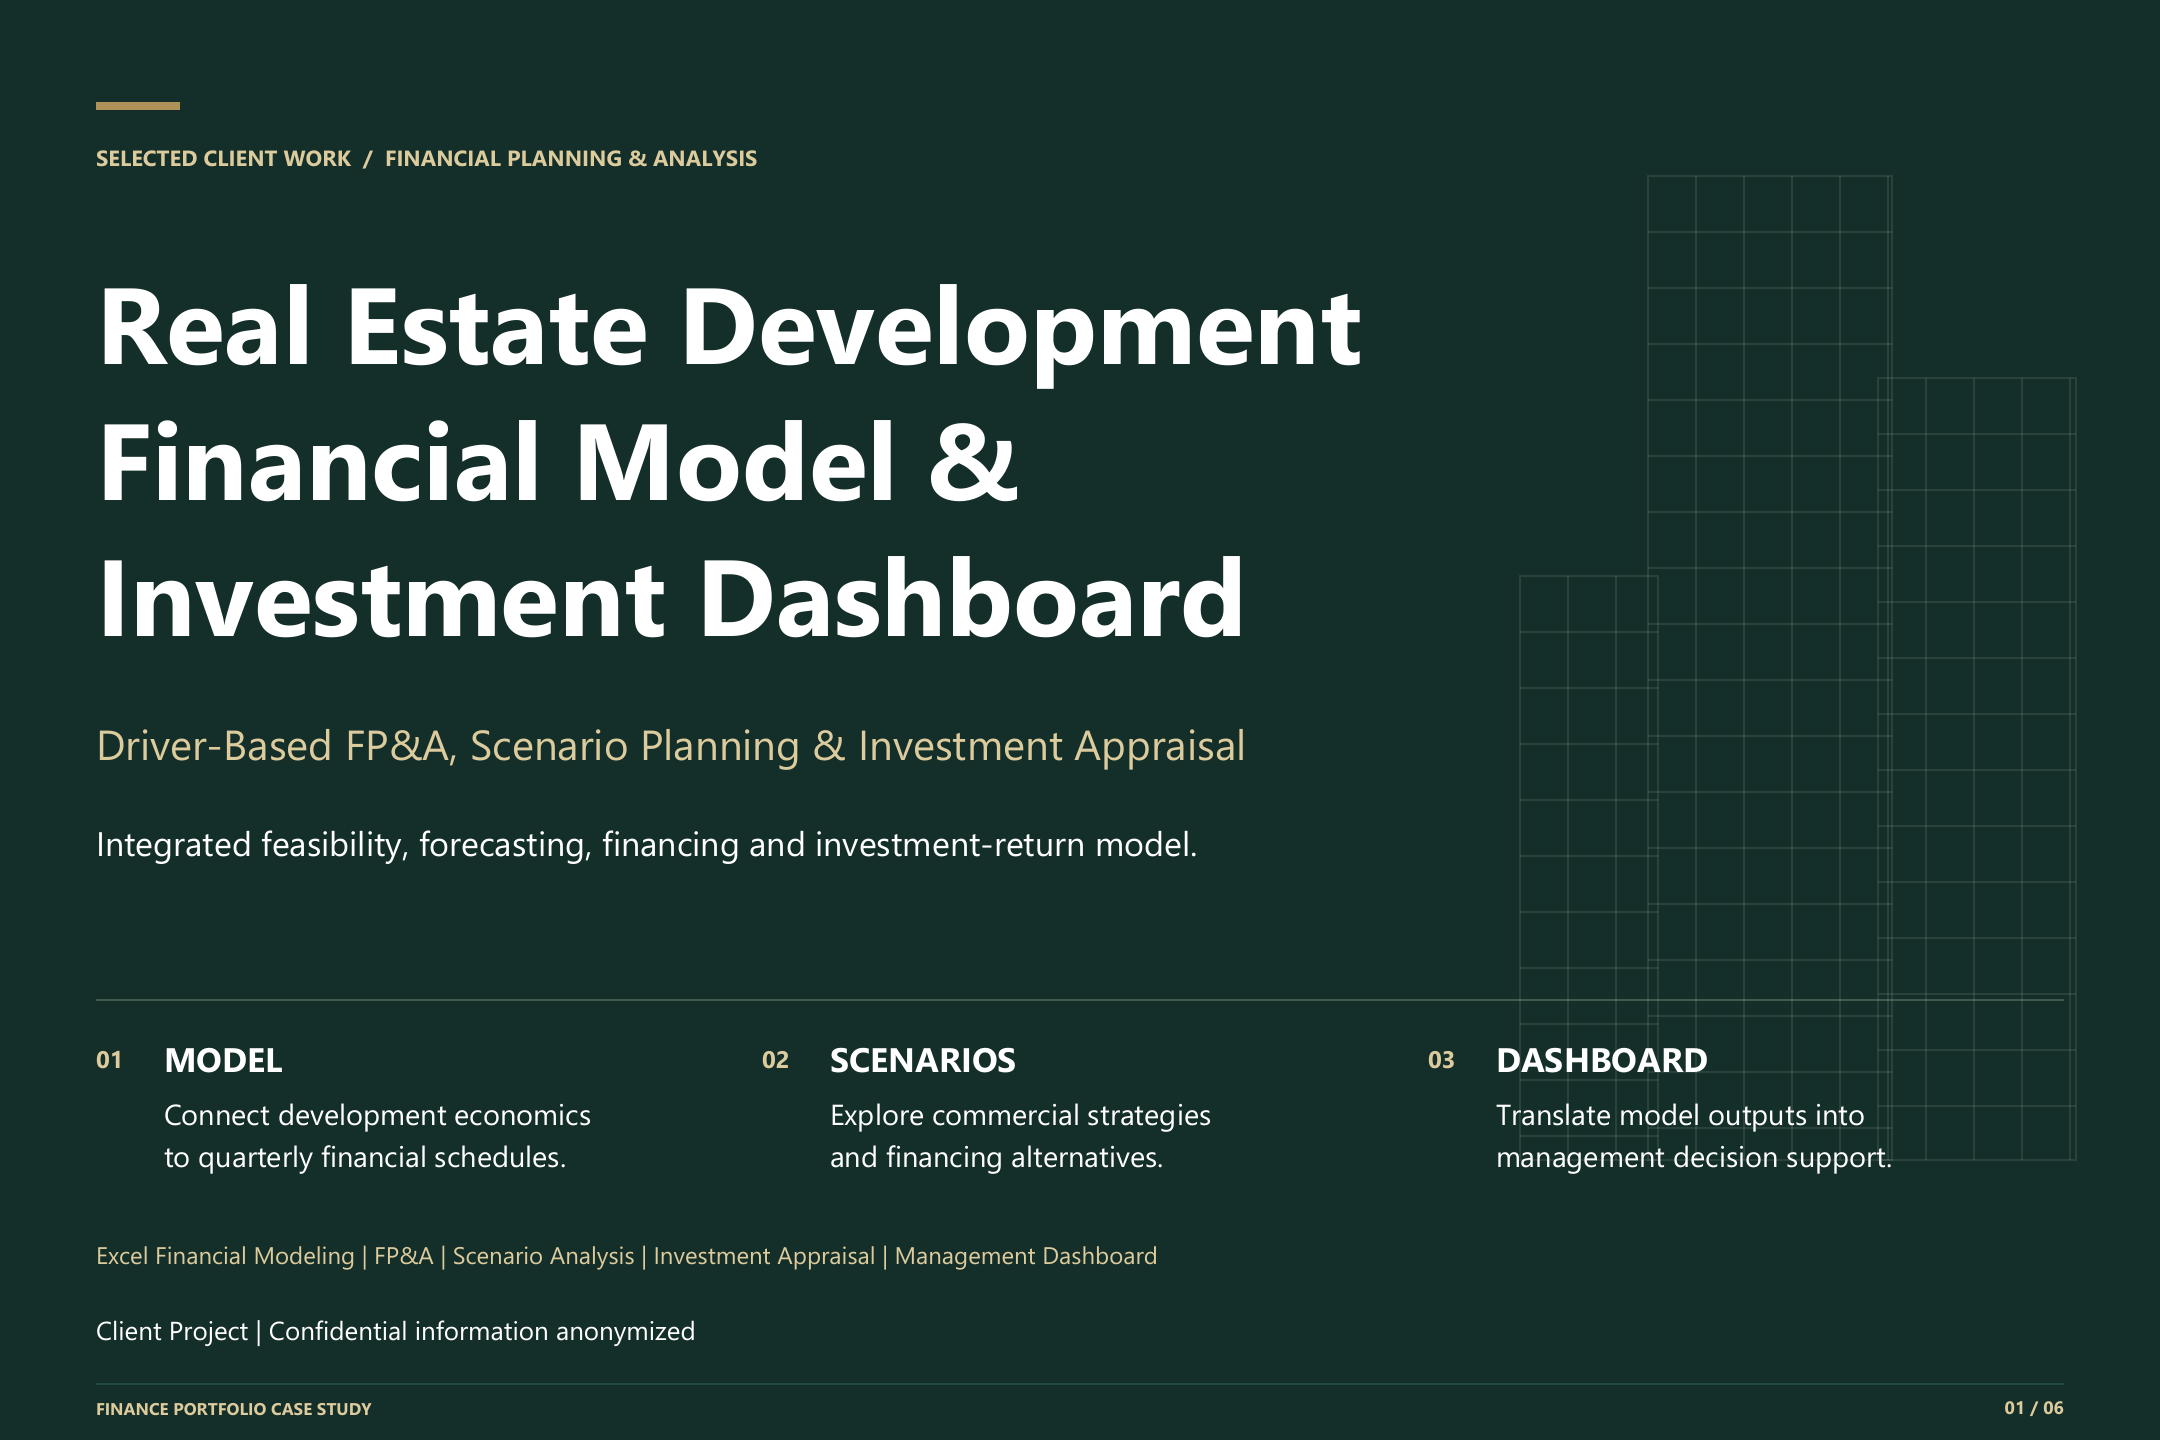
Cover page introducing the real-estate development model, scenario-planning and investment-appraisal story.
Start a conversation
Share the decision you need to support and the data or report you already have.
Work
Browse the complete portfolio of dashboards, models and reporting work. Choose another case study without leaving this page.
 01
01 02
02 03
03 04
04 0506
0506 07
07 08
08 09
09 10
10Use the arrows or swipe to browse the full case-study library.